Debug Window

Debug Window is a tool to display and control breakpoints and monitor the status and values of probes and custom probes in the application context. It was first introduced in LabVIEW 2025 Q3 and combines the functionality of Breakpoint Manager and Probe Watch Window.
Usage
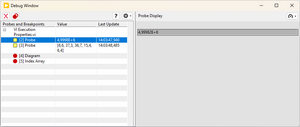
Debug Window automatically appears when the first breakpoint or probe is placed. It can also be opened from the View menu, under Debug Window, or by using the keyboard shortcut Ctrl+D.
It displays the list of breakpoints, probes, and custom probes in the current application context. Double-clicking an entry in the list highlights the corresponding element in a VI. Items can be removed from the list by pressing the Remove Selected Probes and Breakpoints button or using the Delete key. Breakpoints can be enabled or disabled, using the Enable/Disable button.
Probe values update live while the VI executes. When a probe is selected, the Probe Display area shows the probe value in a matching control. The Probe Options button can be used to switch between different probe types, including history and conditional probes. This is an improvement over the original Probe Watch Window, which did not have these options.
-
Probe Options
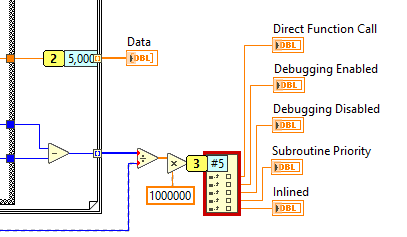
Another new feature is the ability to display probe values directly on a probe. This setting is enabled by default and can be changed from the Debug Options menu next to the help button.
-
Debug Options
-
Show Values on Wires
History
- LabVIEW 2025 Q3:
- Added Debug Window


